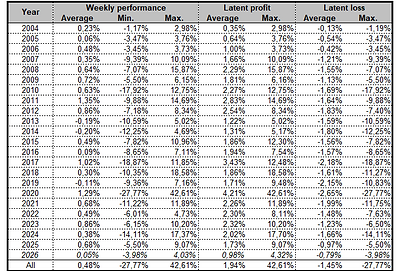
The Volatility Hedge
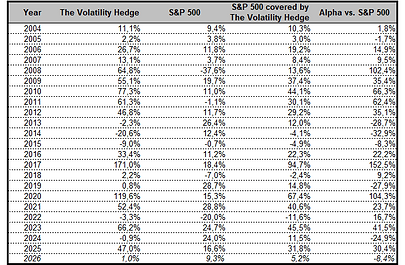
Monthly and weekly performances, with variability, draw backs and latent gains and losses:

Detailed monthly performances since the launch of the service in 2017:


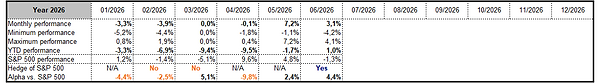
(All figures are updated on 06/30/2026, and will be updated monthly)
Rentability calculator
You may use this calculator to assess the relevance of this service for you based on amounts and estimated performances:
Cash-flow estimator
You may use this tool to estimate the cash flow generated by this service, between two dates since 2004, for past years. This rather rough estimate is obtained by linearizing the annual cash-flow, and has a long-term vocation, over periods of several years. The purchase cost is recorded on the start date and on each anniversary date. A comparison with S&P 500 index during the same period is provided.